- Published on
EURUSD - Week commencing 25-09-23
- Authors

- Name
- Tradeaze
Introduction
Here we go, another week of potential opportunities to make some money or get rekt! 😂
Monthly chart
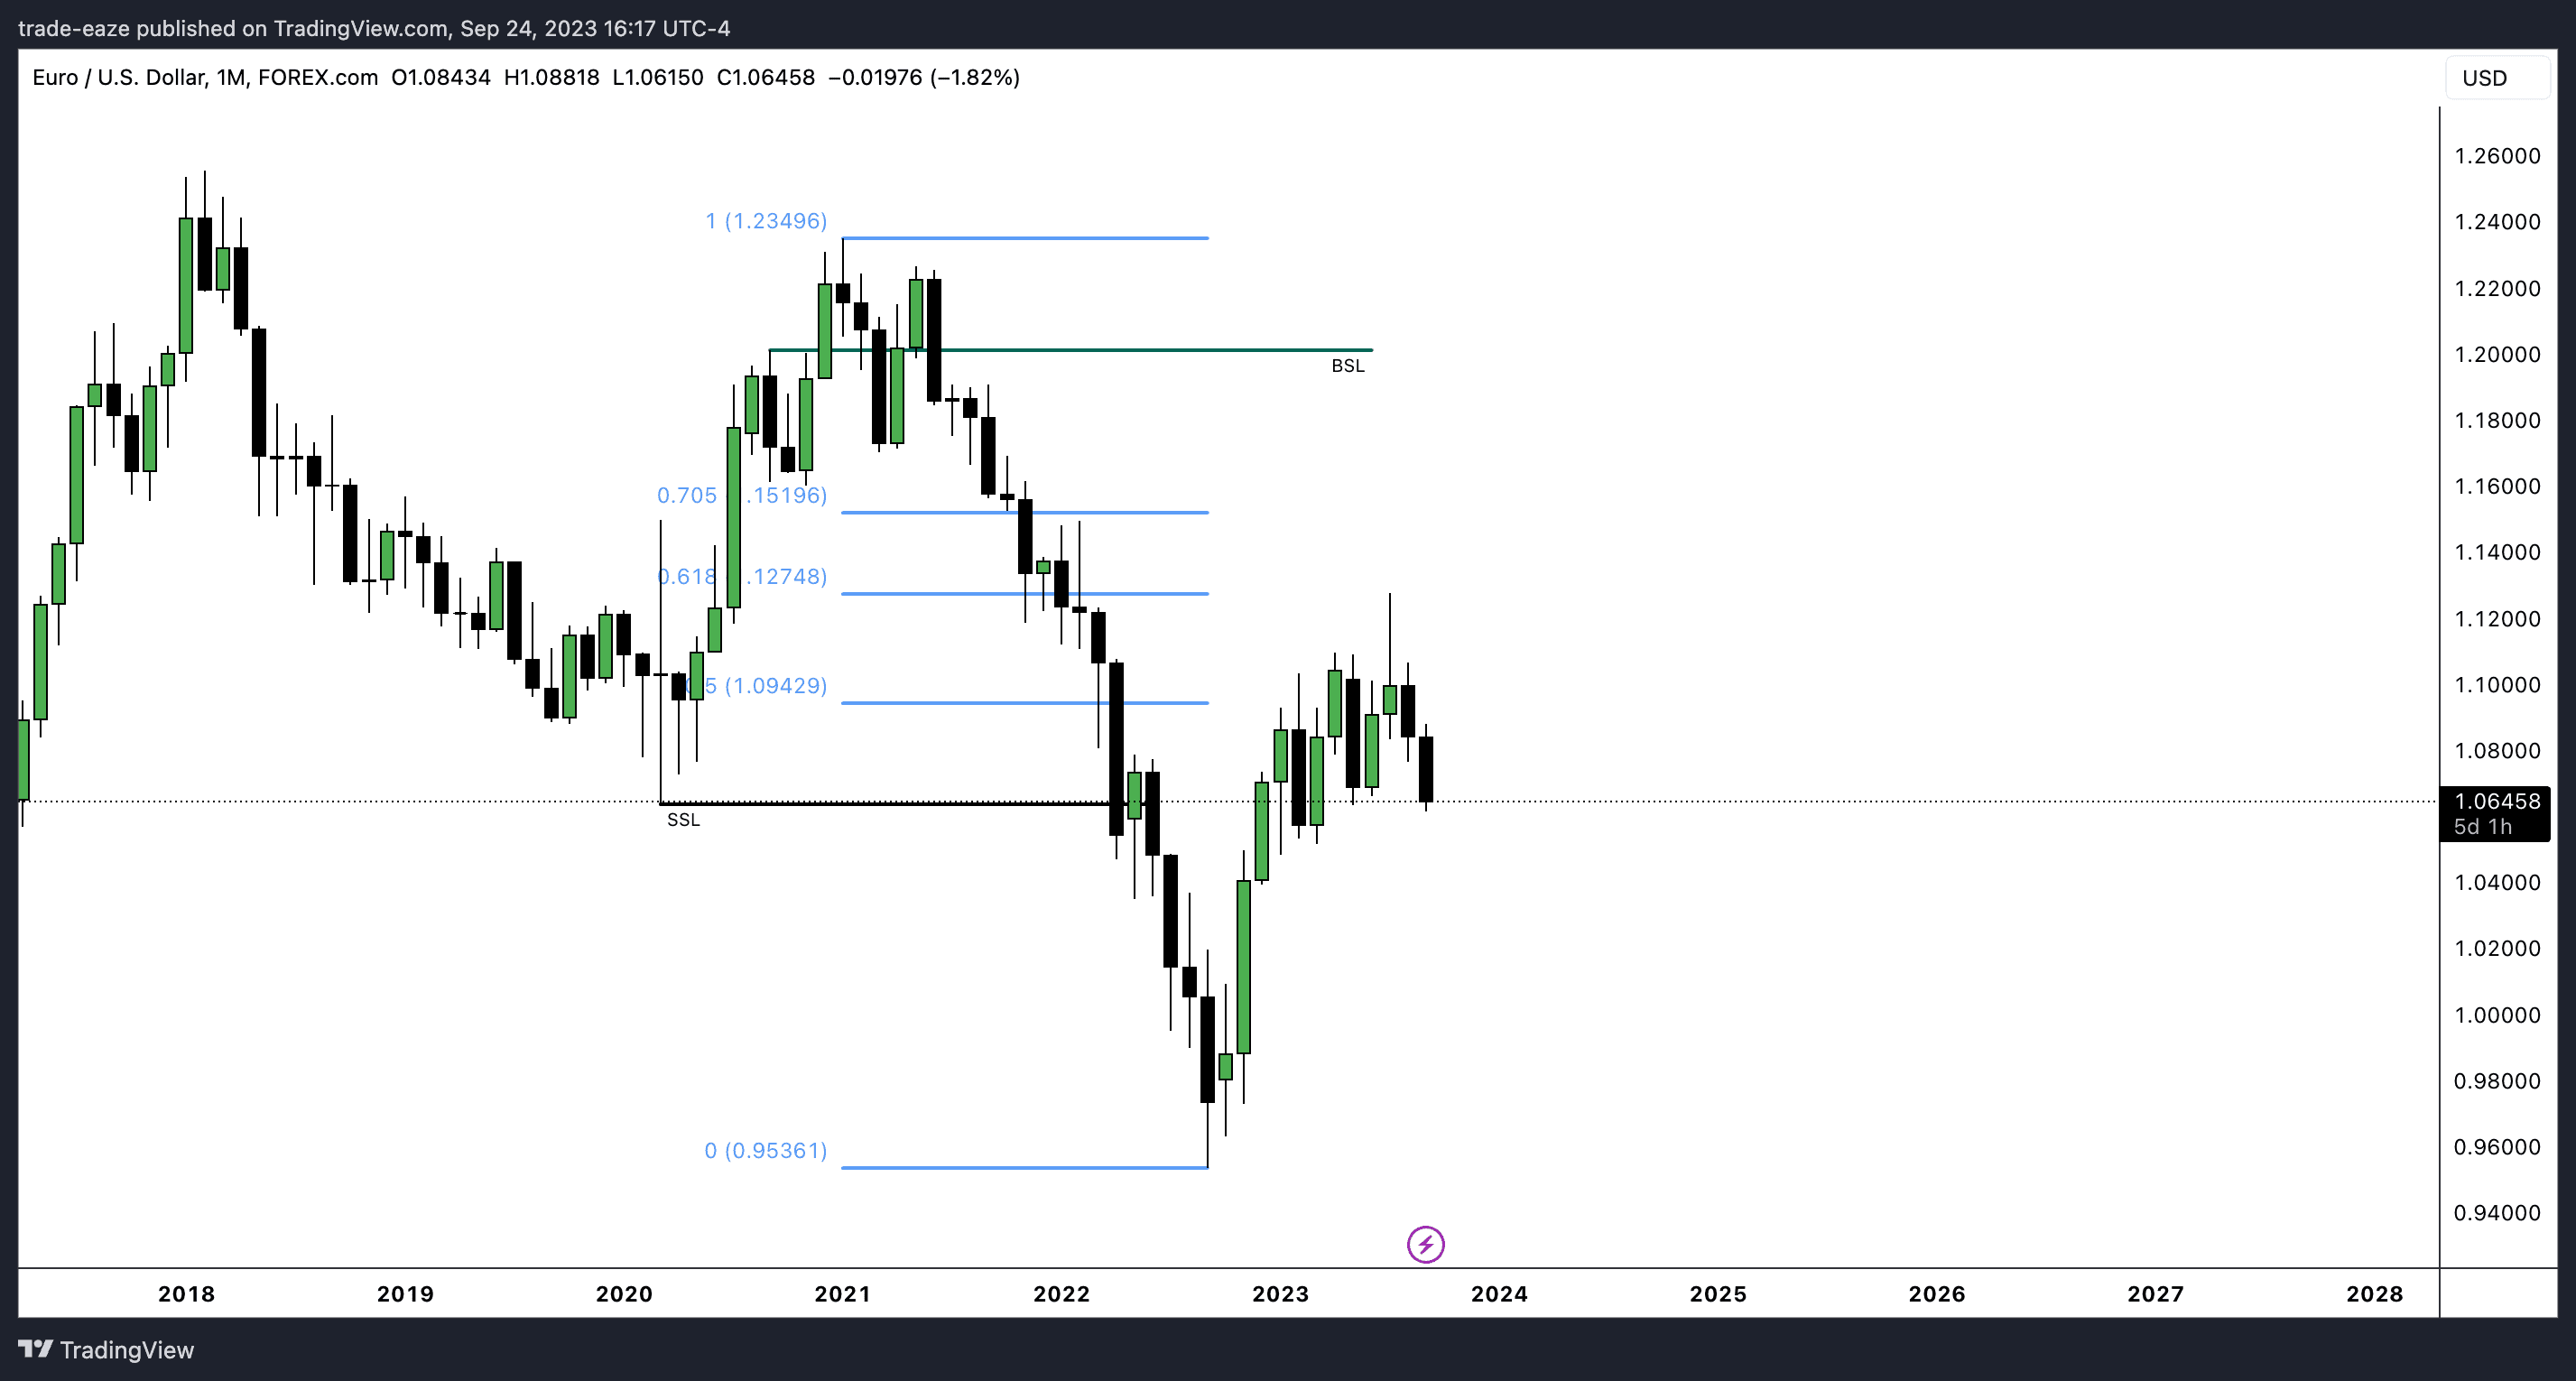
My views on the monthly haven't changed since last week.
The most recent price action (if there is such a thing as recent on the monthly timeframe) showed me a buy-side liquidity (BSL) run, before declining to take out the sell-side liquidity (SSL). Anchor a fib on that dealing range and we can see price in the last few months reached the 0.618 fib level and continued its decline. After its retracement it could consolidate which you could argue it has done, we can now expect an expansion to the downside.
Weekly chart
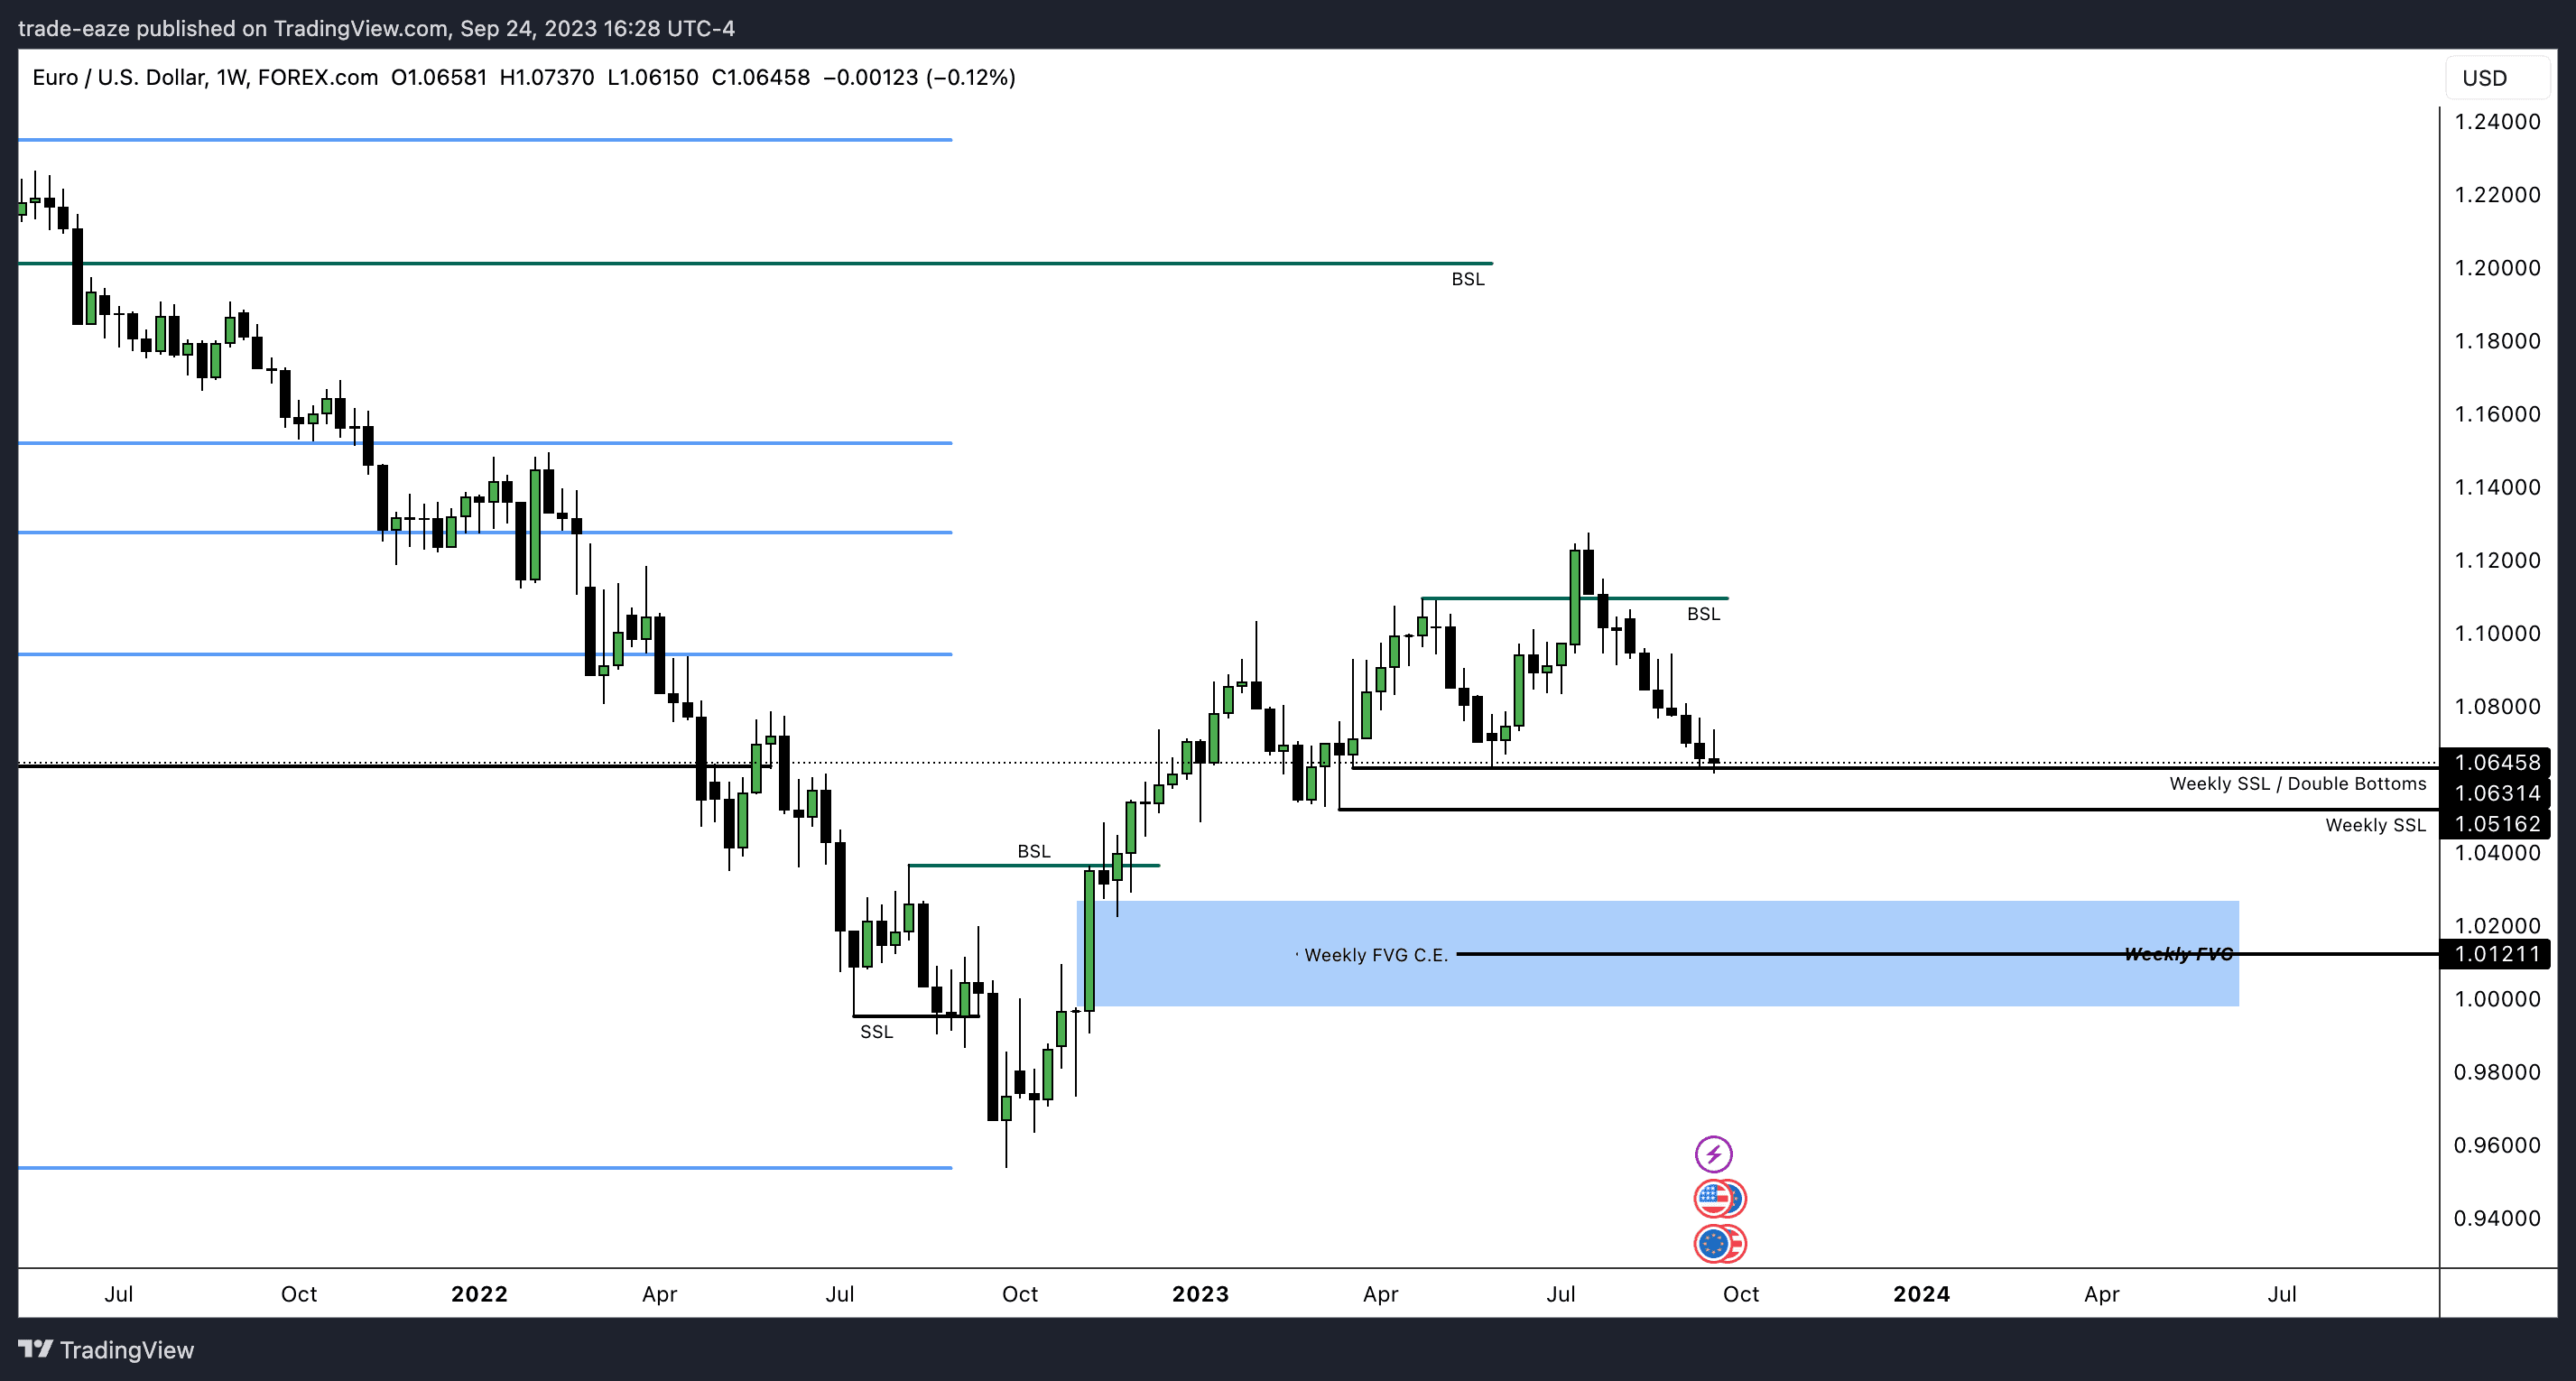
Price has dropped down to sweep the ssl liquidity but barely, so I'm expecting price to drop down much lower. Coupled with the fact that we have a longer term dealing range on the weekly with an FVG at a discount that has C.E to be traded to in order to be "efficiently traded". I'm anticipating price to head lower over the coming weeks.
Daily chart
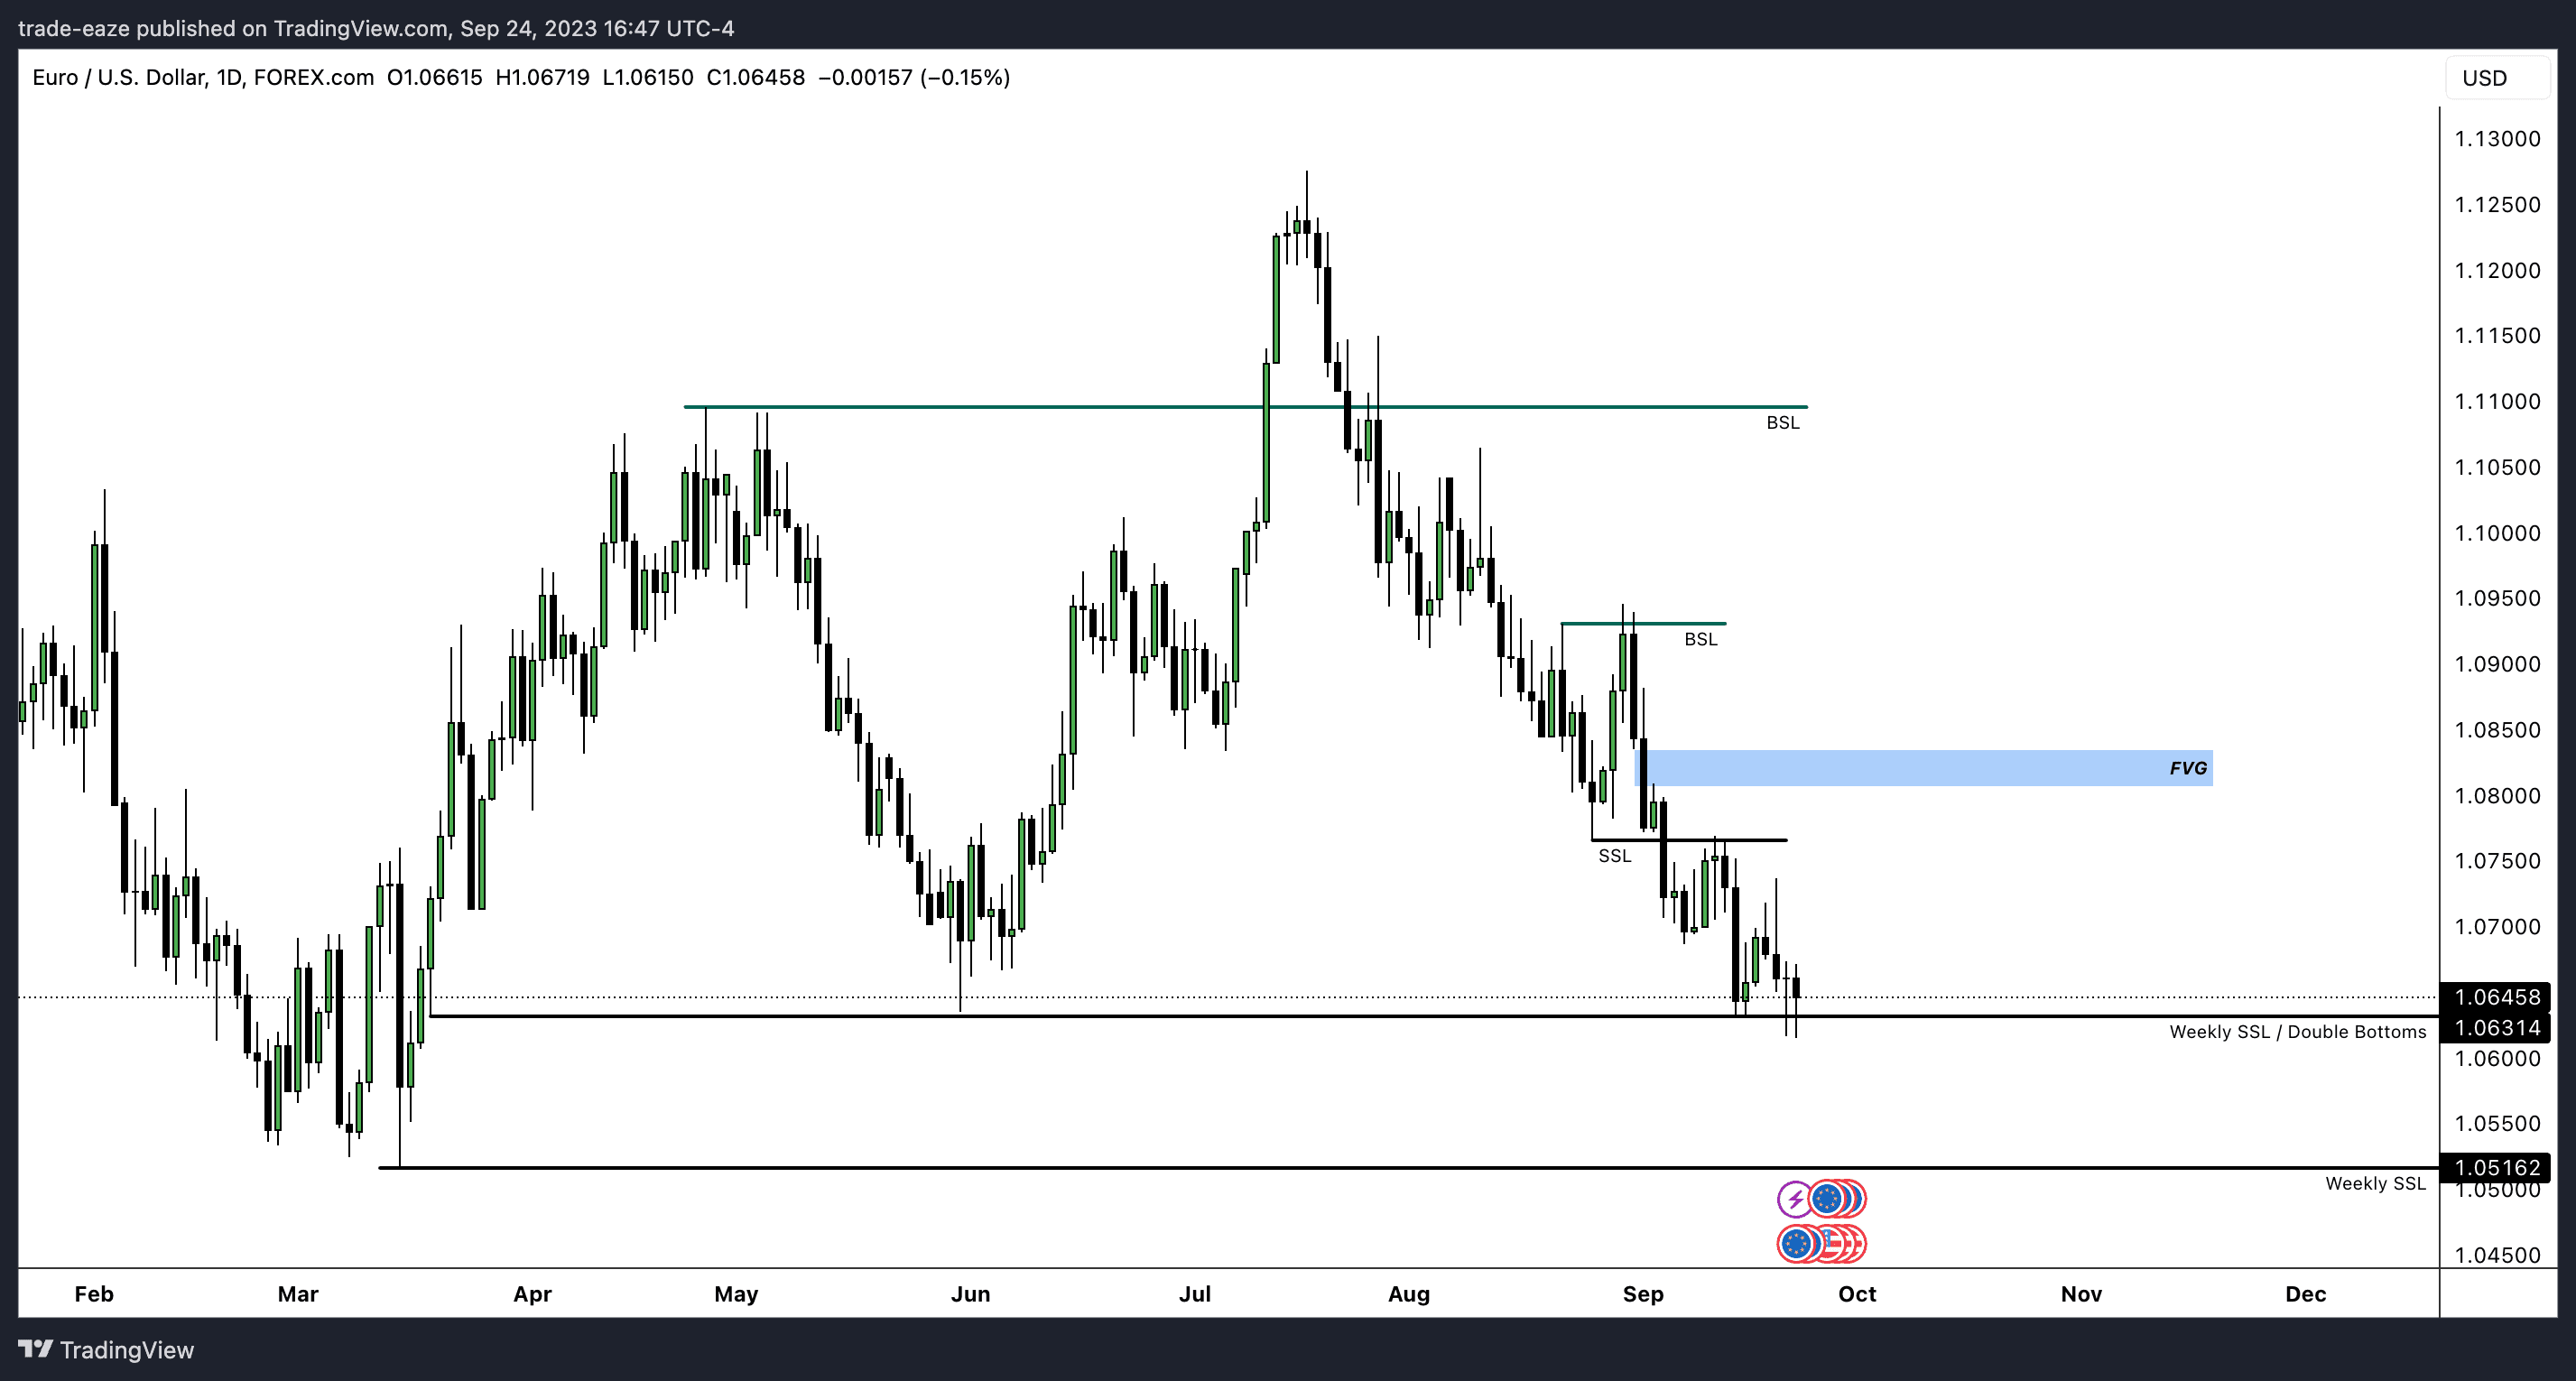
The FVG I have marked out has my interest. I'm not seeing anything right now that indicates we'll see that in the next few days. No swing low formed at the end of next week, may see that tomorrow (25th). So a little unclear on this timeframe. Worth noting the choppiness in daily, which is more visible on the lower time frames.
H4 chart
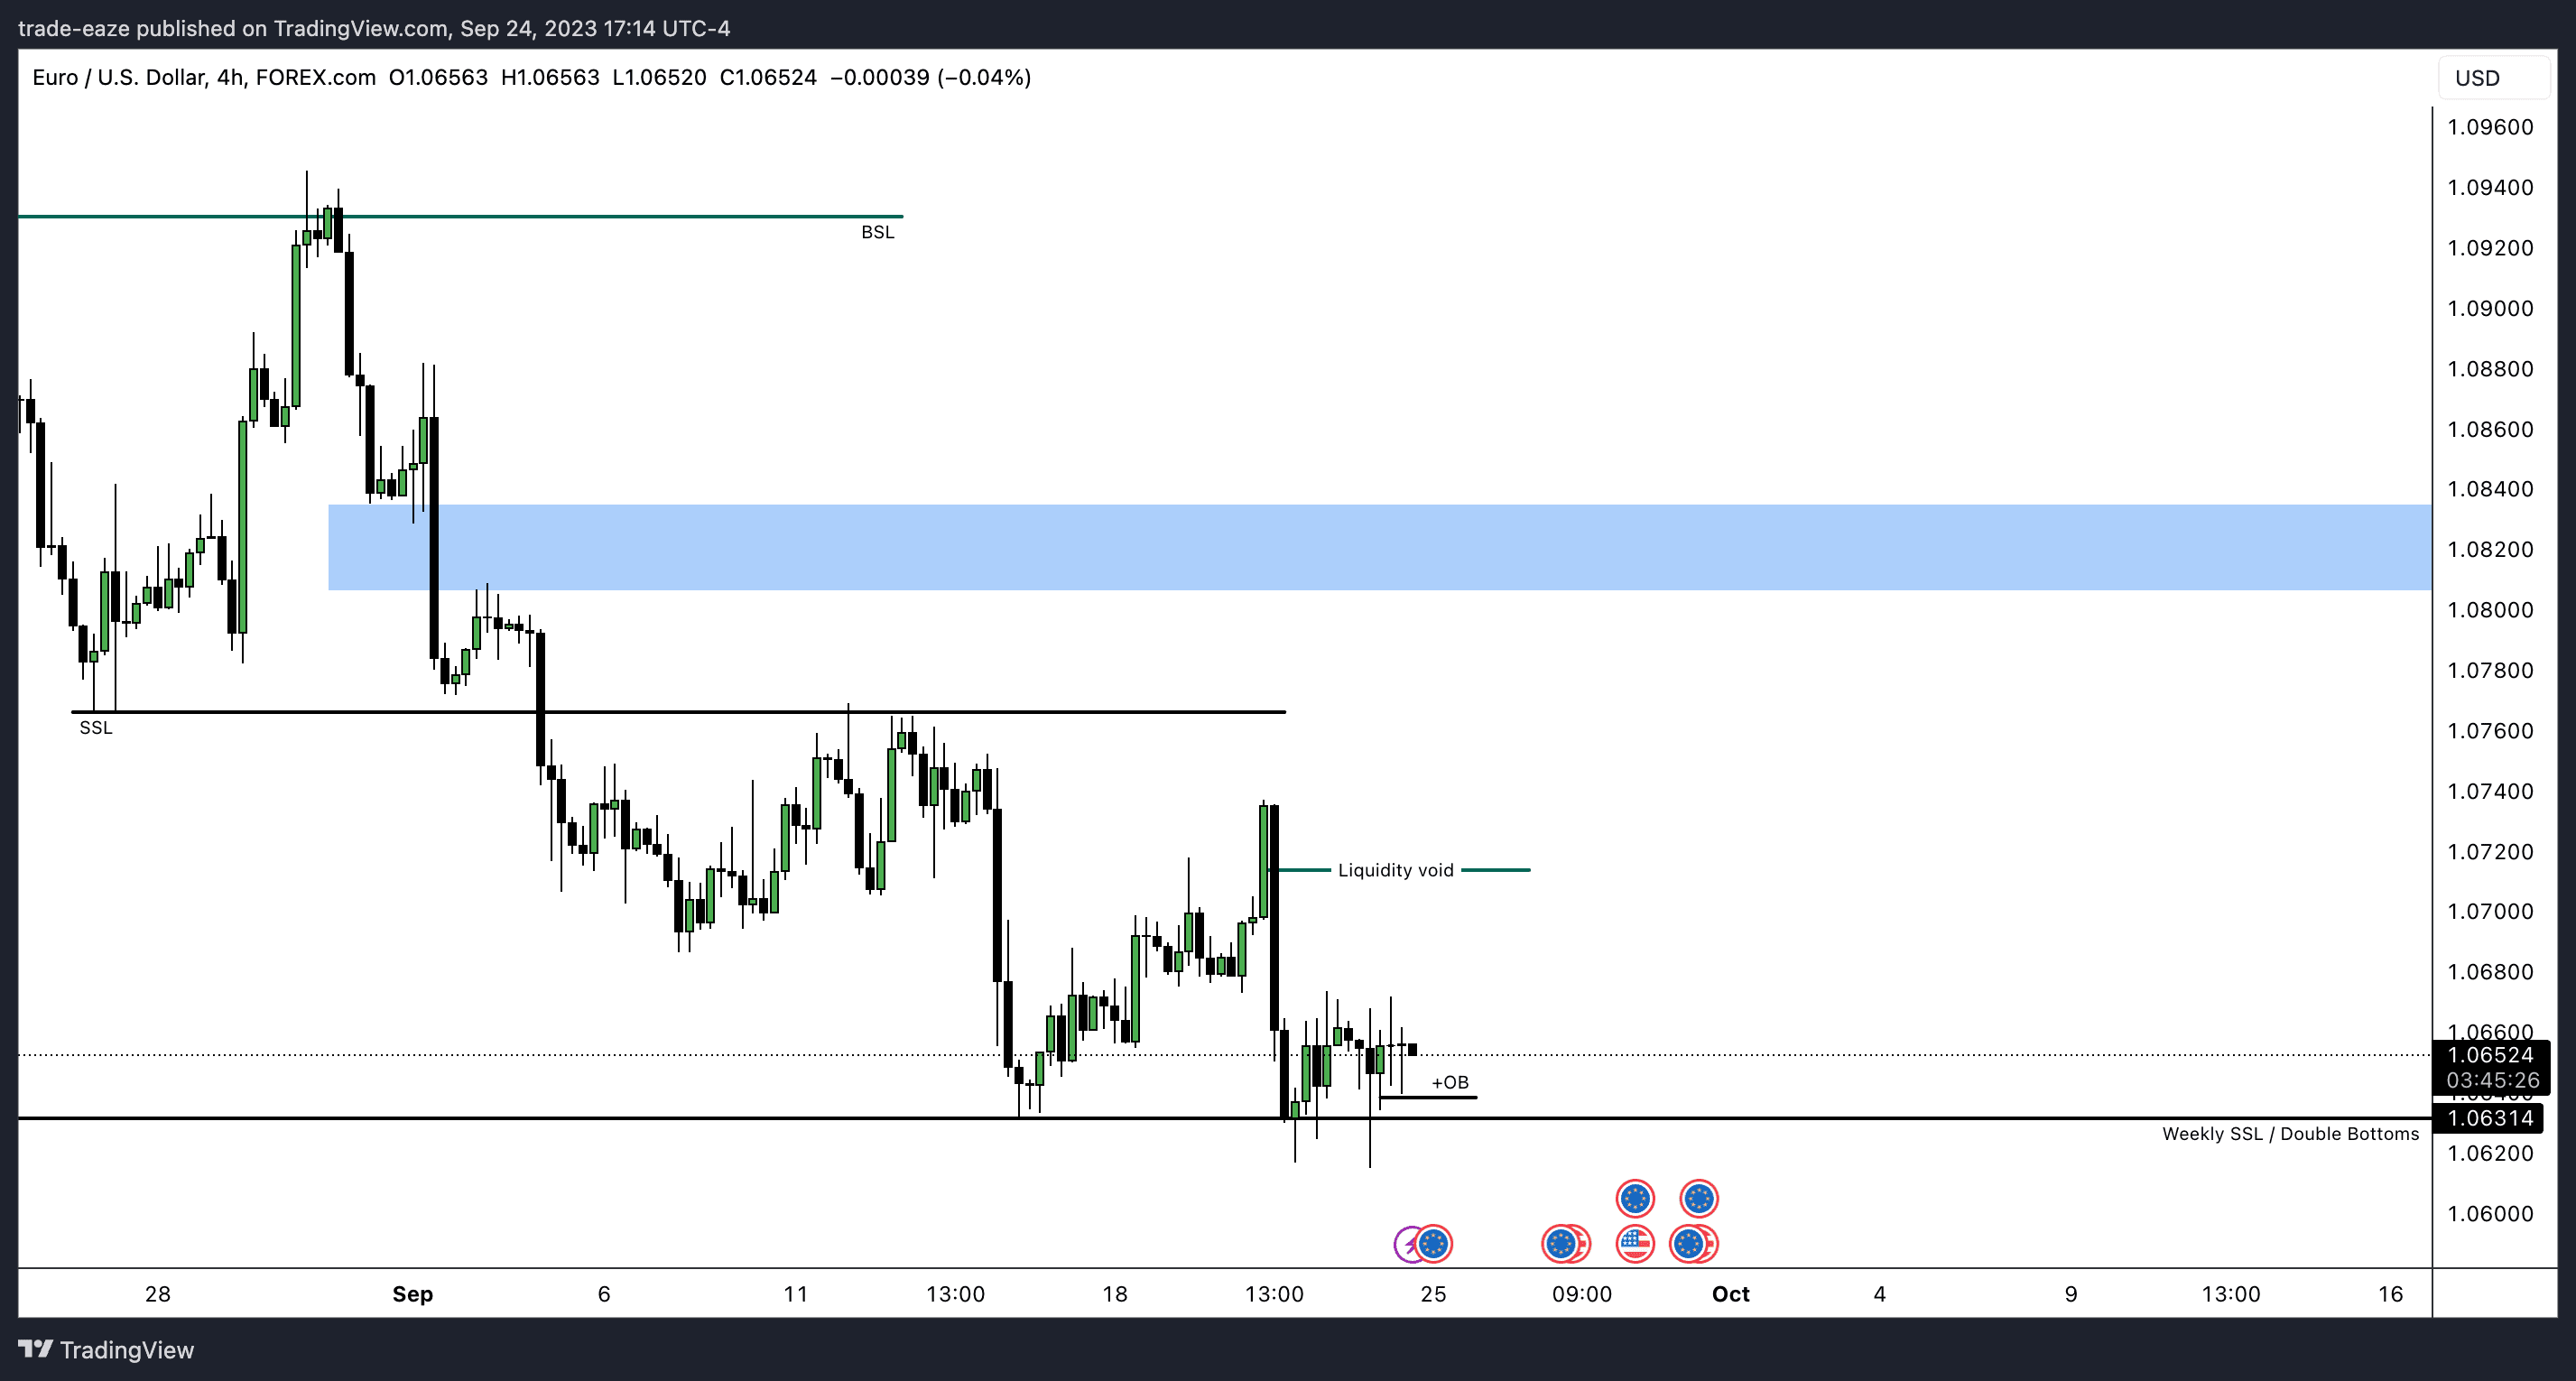
No real clarity for me on this chart. Price appears to be consolidating.
H1 chart
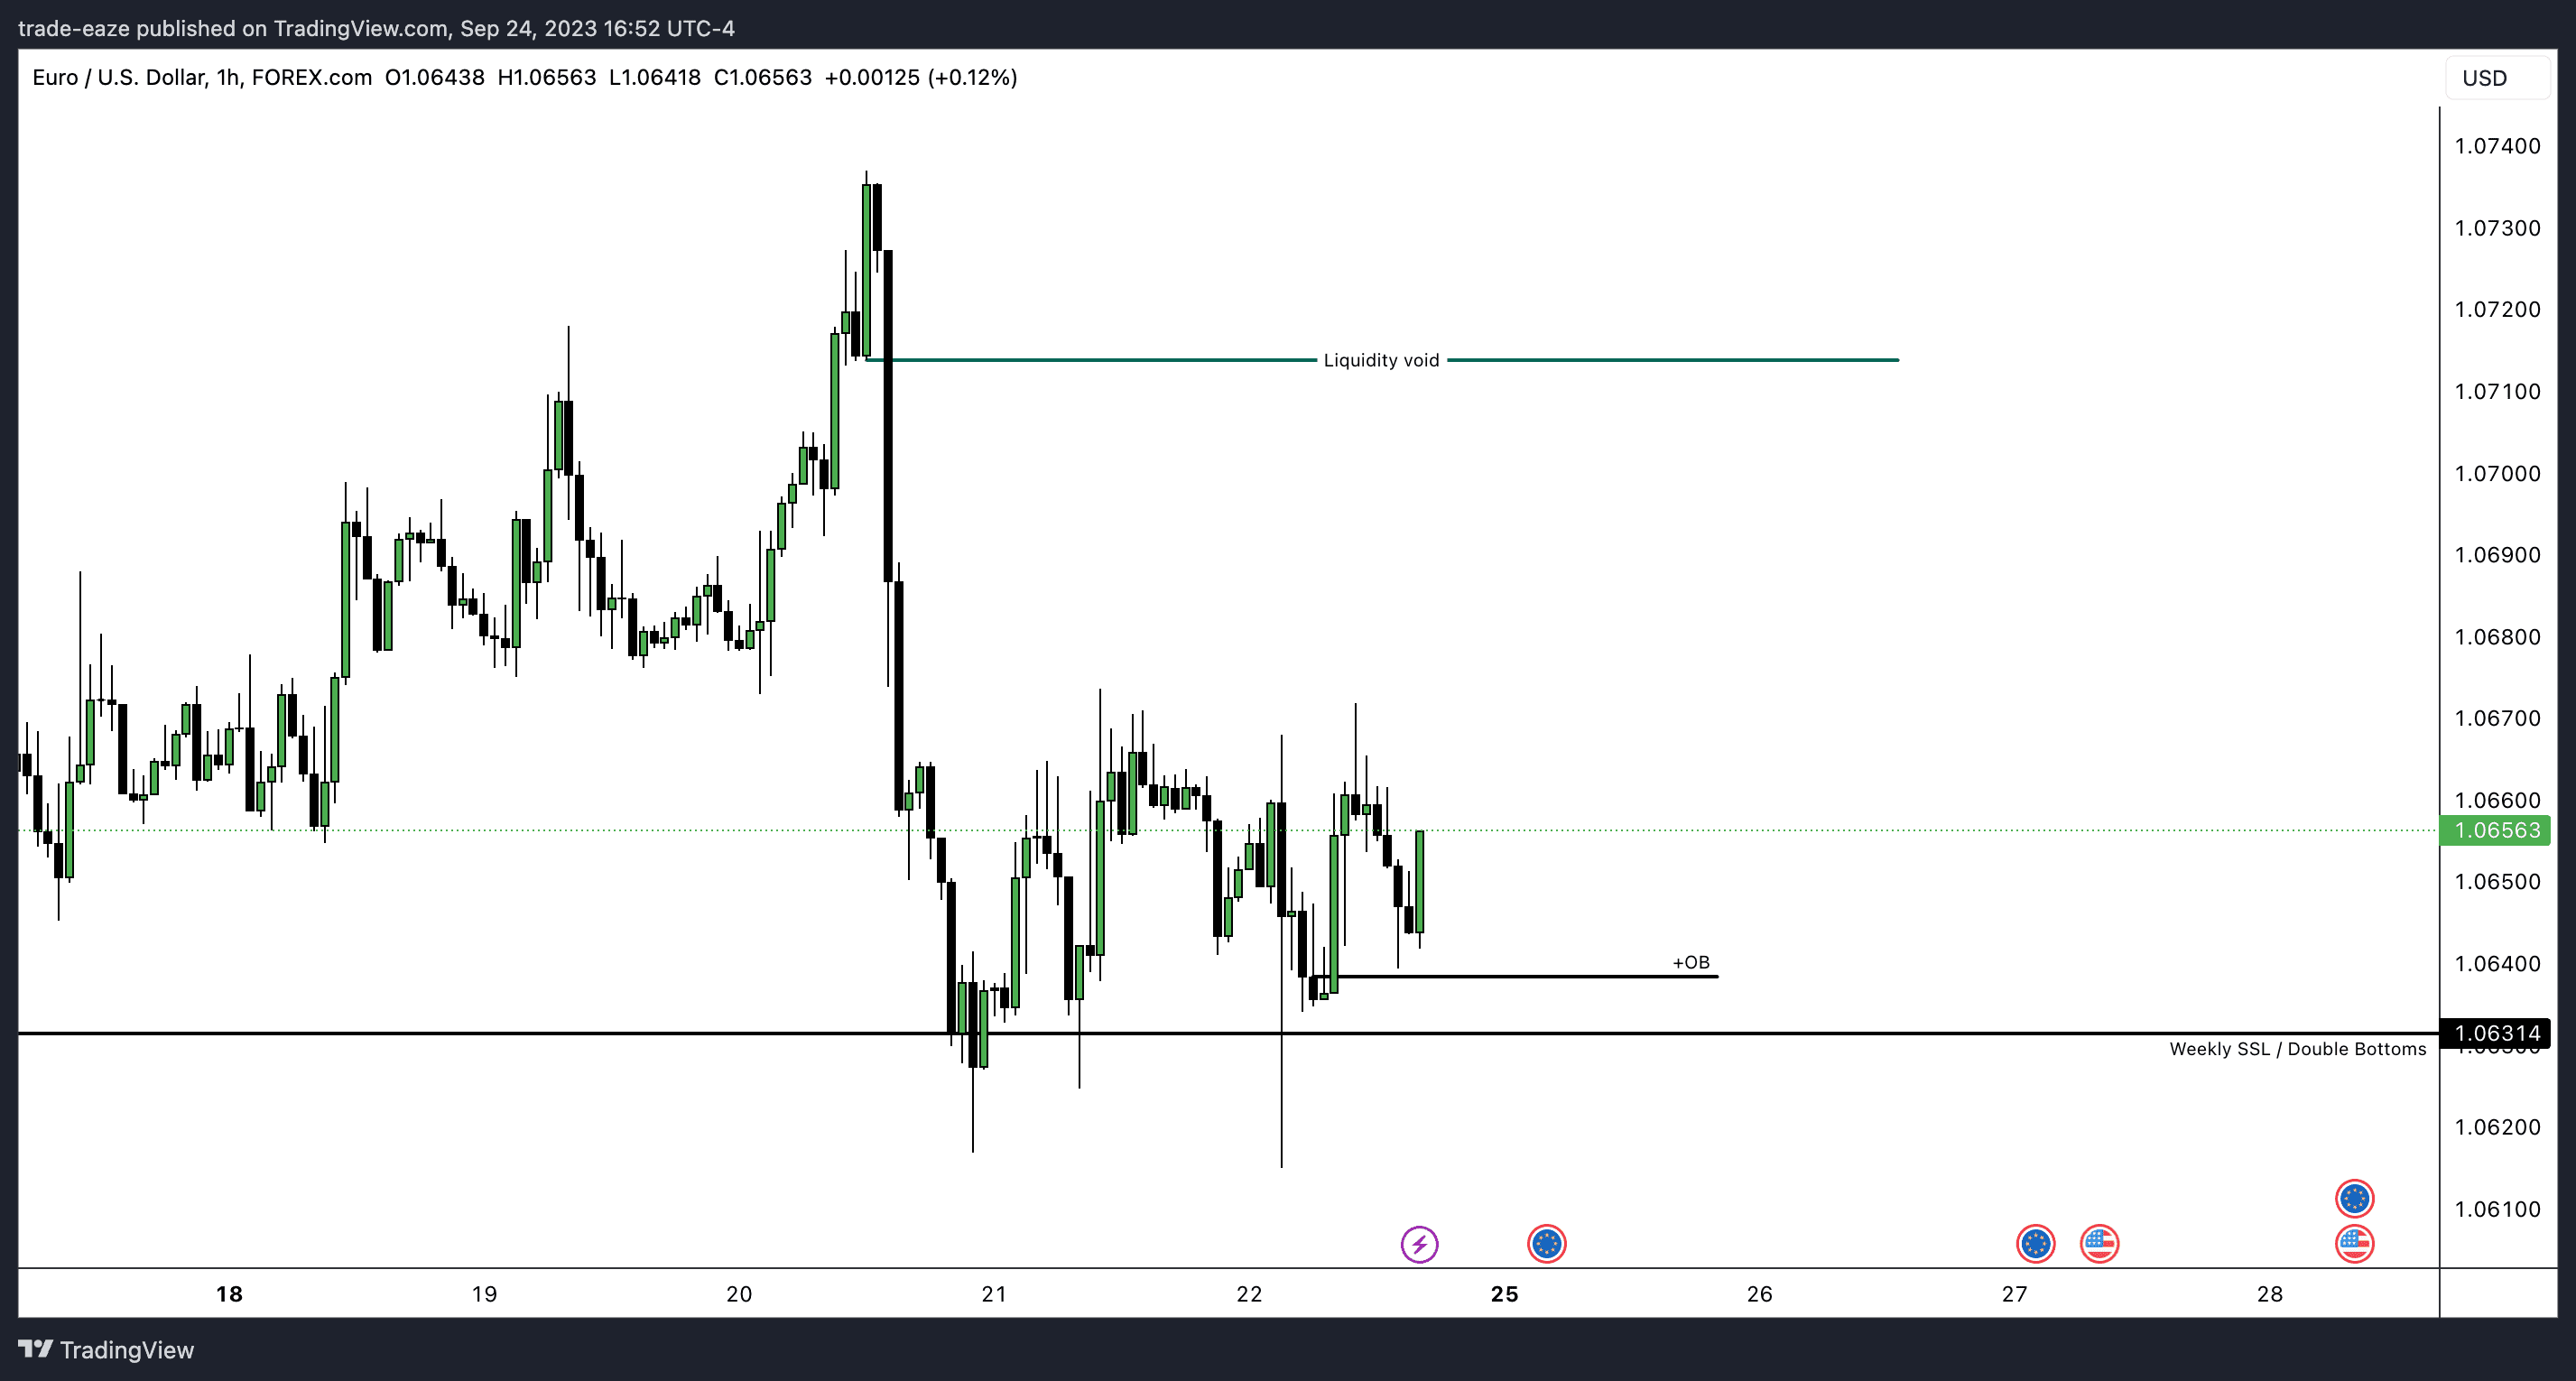
Similar to H4, no real clarity but definitely potentials for a long position if the OB I've marked out holds or reaches it during a killzone with a view to fill in the liquidity void.