- Published on
EURUSD - Week commencing 18-09-23
- Authors

- Name
- Tradeaze
Introduction
I've not looked at the DXY nor have I looked at COT data or anything like, this is strictly technical analysis this week. I did have a glance at the economic calendar and noted FOMC on Weds 20th.
A concept I was stuck with was dealing ranges. I found it difficult to work out what the current dealing range price was in, in order to determine my premium and discount areas.
Monthly chart
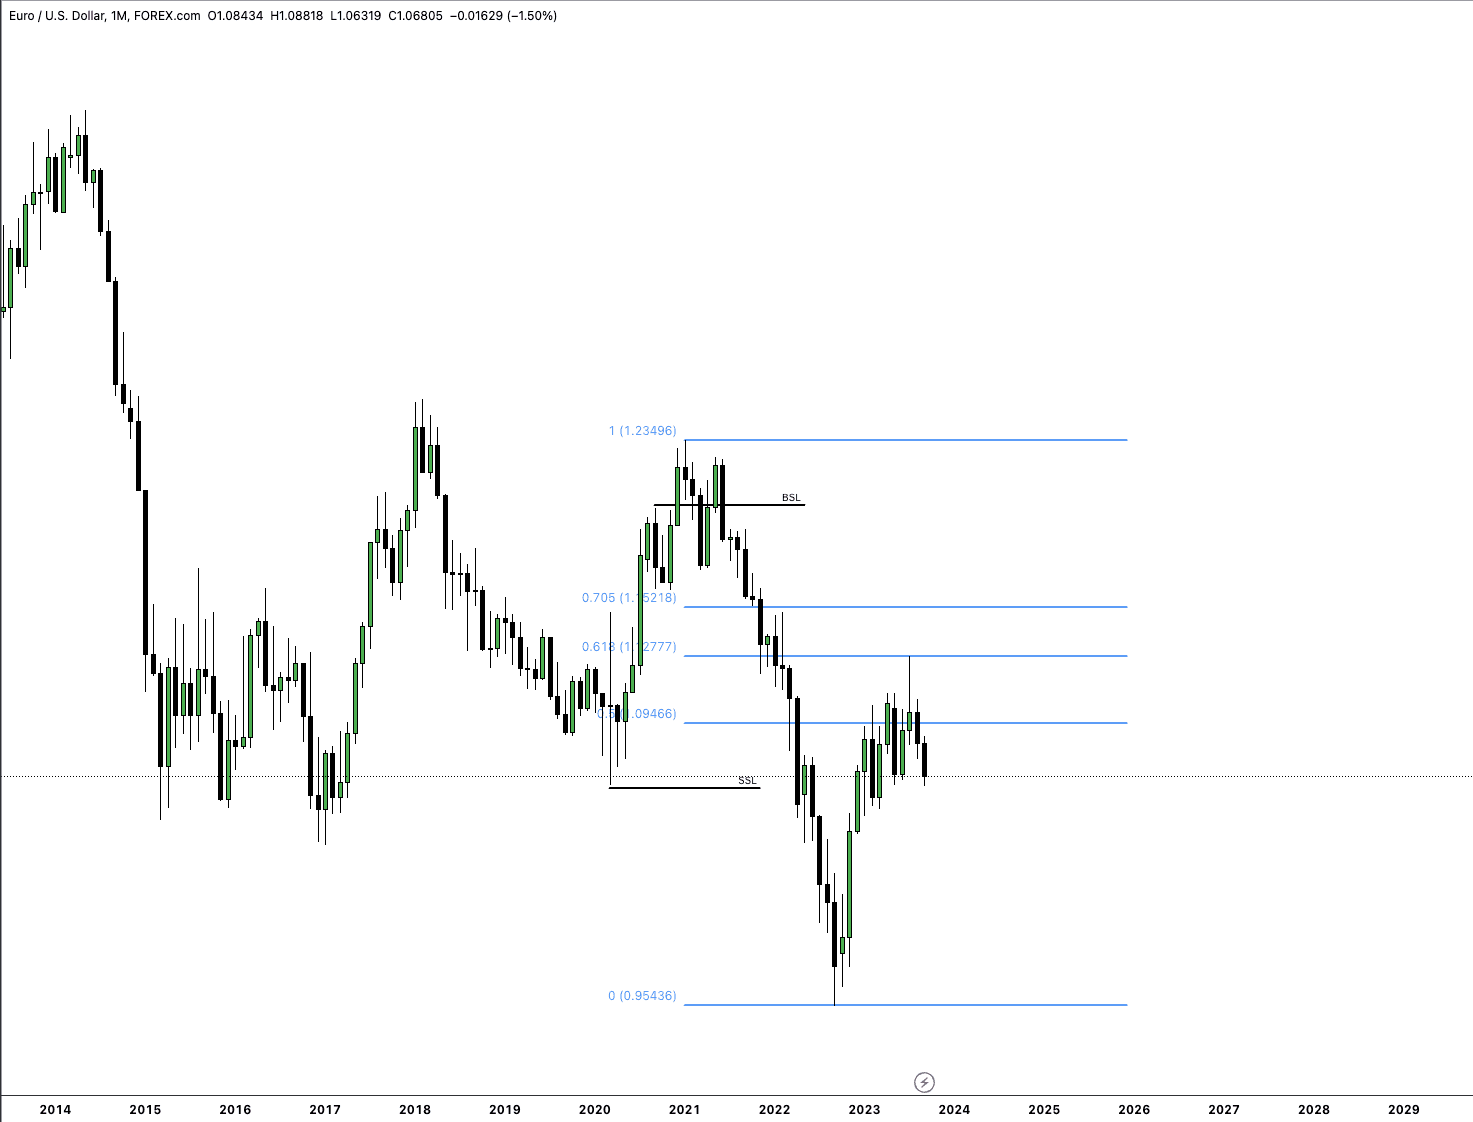
The most recent price action (if there is such a thing as recent on the monthly timeframe) showed me a buy-side liquidity (BSL) run, before declining to take out the sell-side liquidity (SSL). Anchor a fib on that dealing range and we can see price in the last few months reached the 0.618 fib level and continued its decline. After its retracement it could consolidate which you could argue it has done, we can now expect an expansion to the downside.
Weekly chart
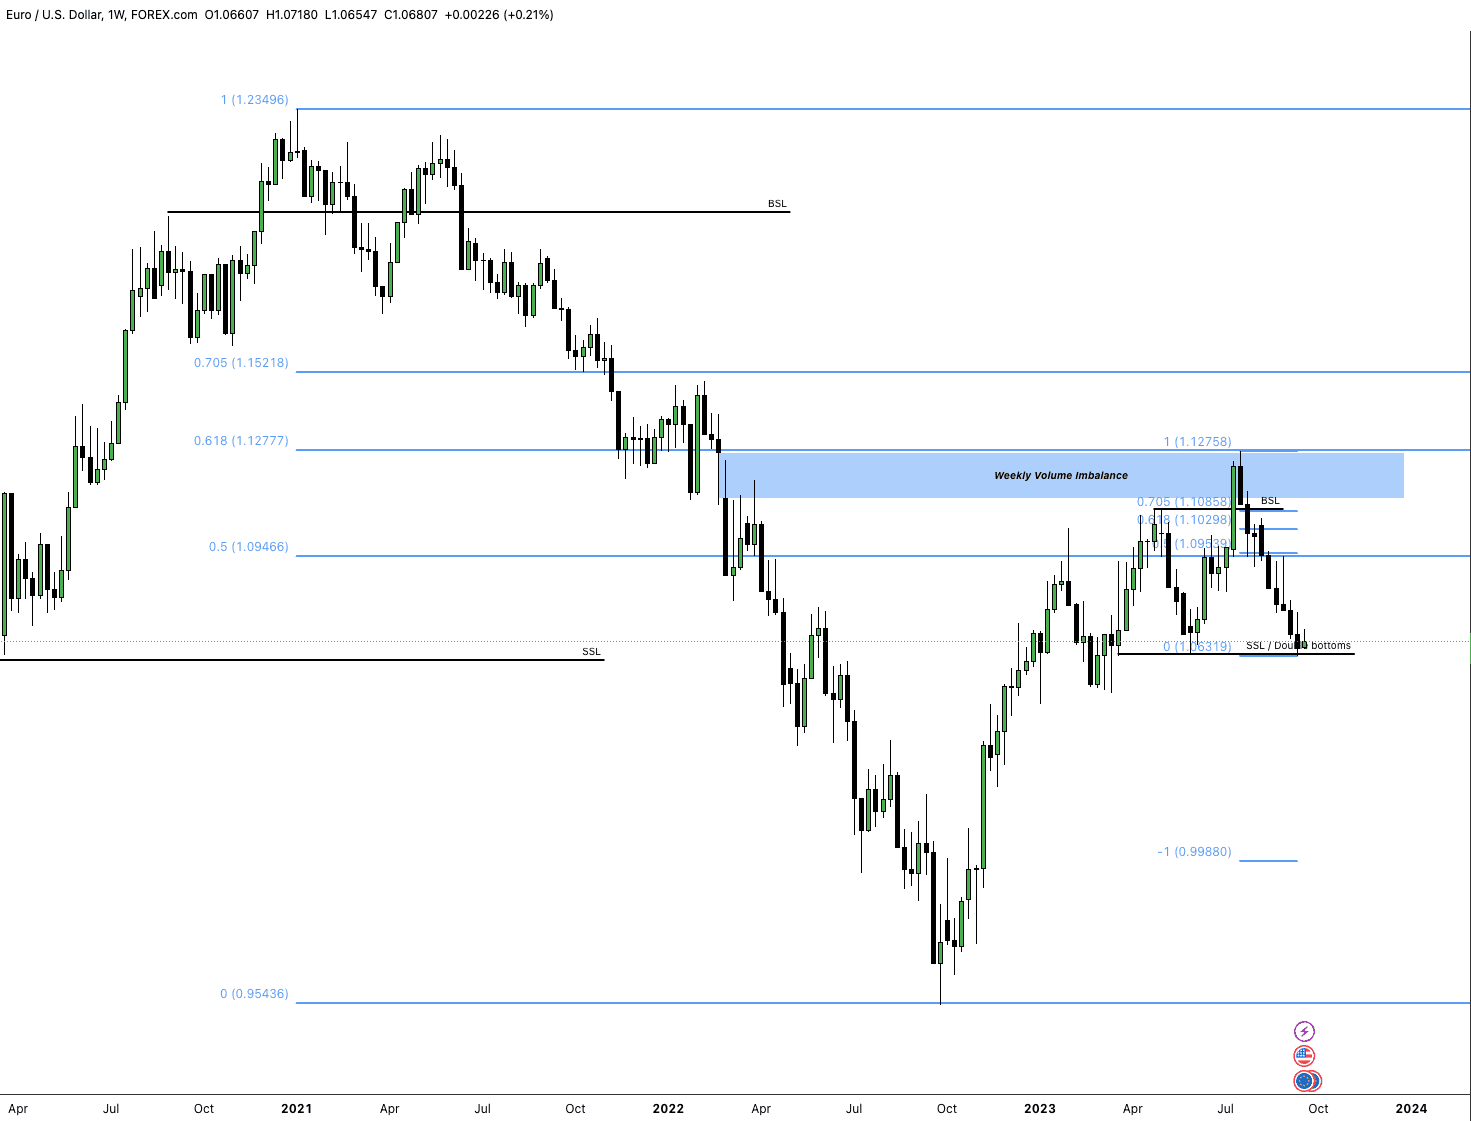
Dropping down to the weekly chart, I noted the volume imbalance which EURO traded up to, filled in and its subsequent decline. Again noting the BSL and the double bottoms which was tapped into last week. There is no weekly swing low, so not sure if we should expect to see one or if price will continue to decline.
Daily chart
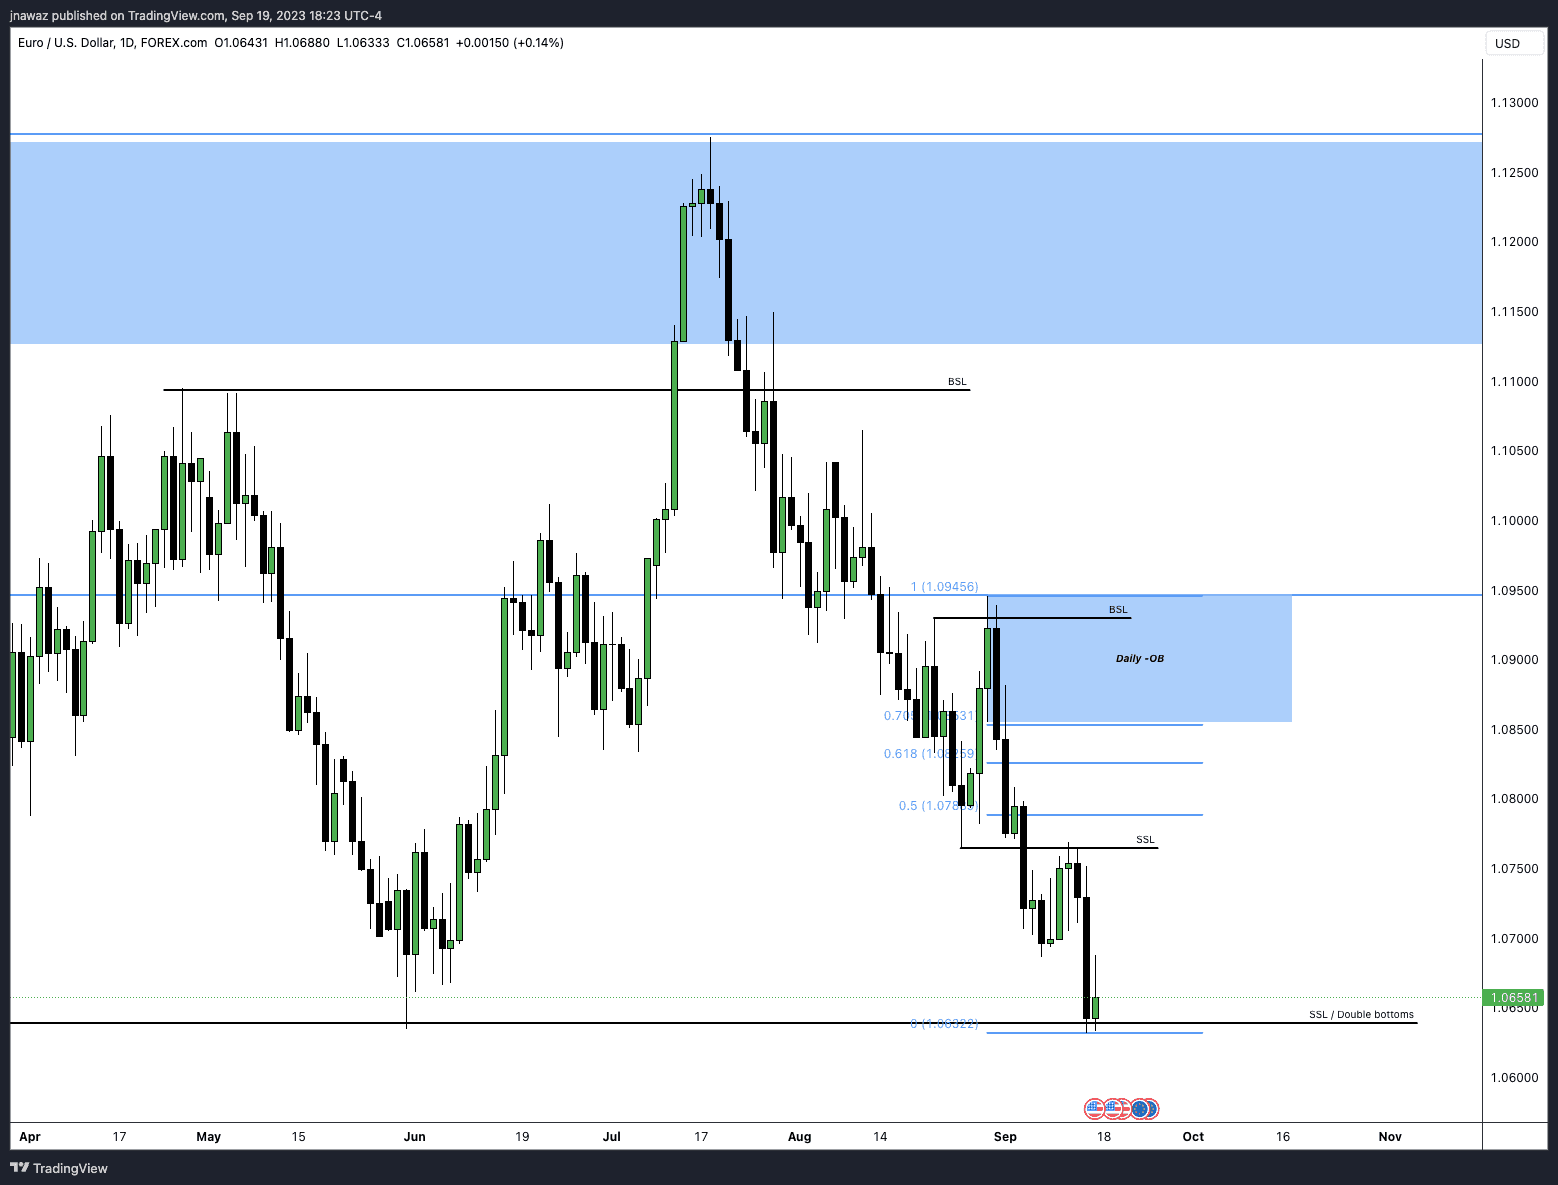
Dropping down to this timeframe I've denoted the current dealing range and there is a swing low on the daily formed with Friday's candle. There are a few thoughts going through my head at this point.
- We haven't convincingly ran the weekly SSL, given the daily dealing range
- Is it too much to expect a 200ish pip rally to the bearish order block for further shorts (we do have FOMC this week)? Let's wait and see.
- Thinking about a weekly profile, could Mon-Weds give me the high of the week in that Bearish order block I've denoted.
- The most recent price action that broke the previous swing low isn't the daily timeframes dealing range because there isn't any BSL it took prior to that move down.
H4 chart
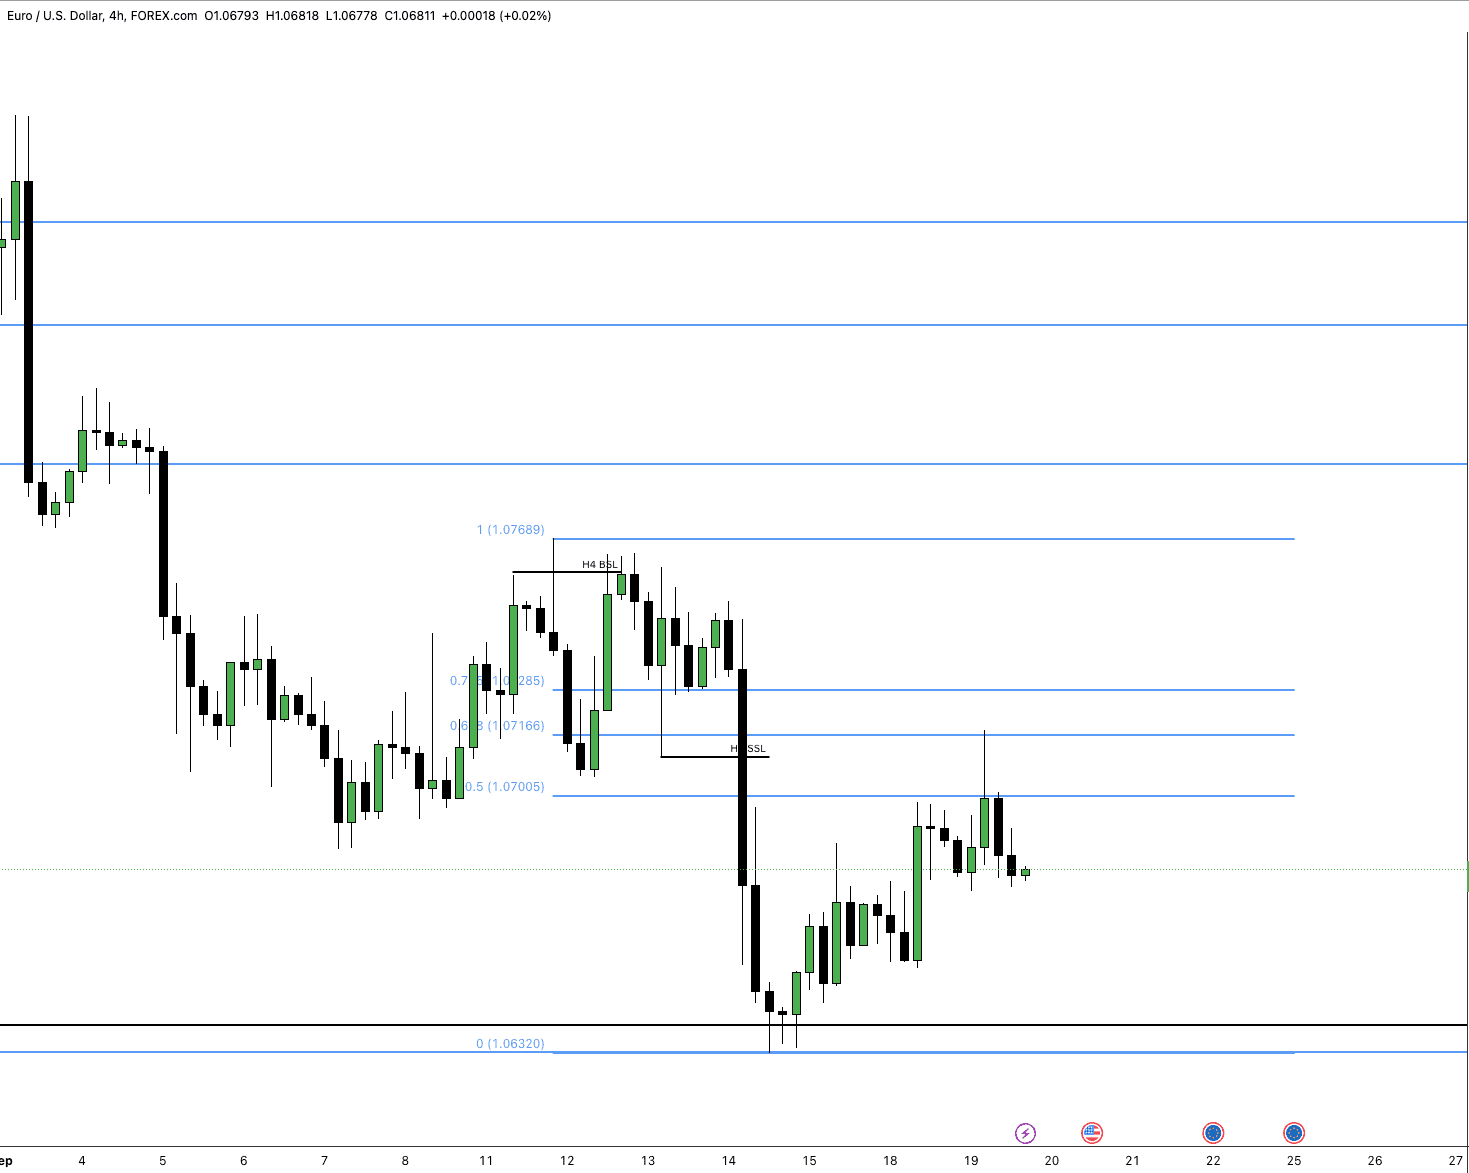
I'll be honest, not seeing anything clear on this chart aside from noting the current dealing range and the liquidity void, this is aligning with the idea that potentially we will move back up into that daily bearish order block.
H1 chart
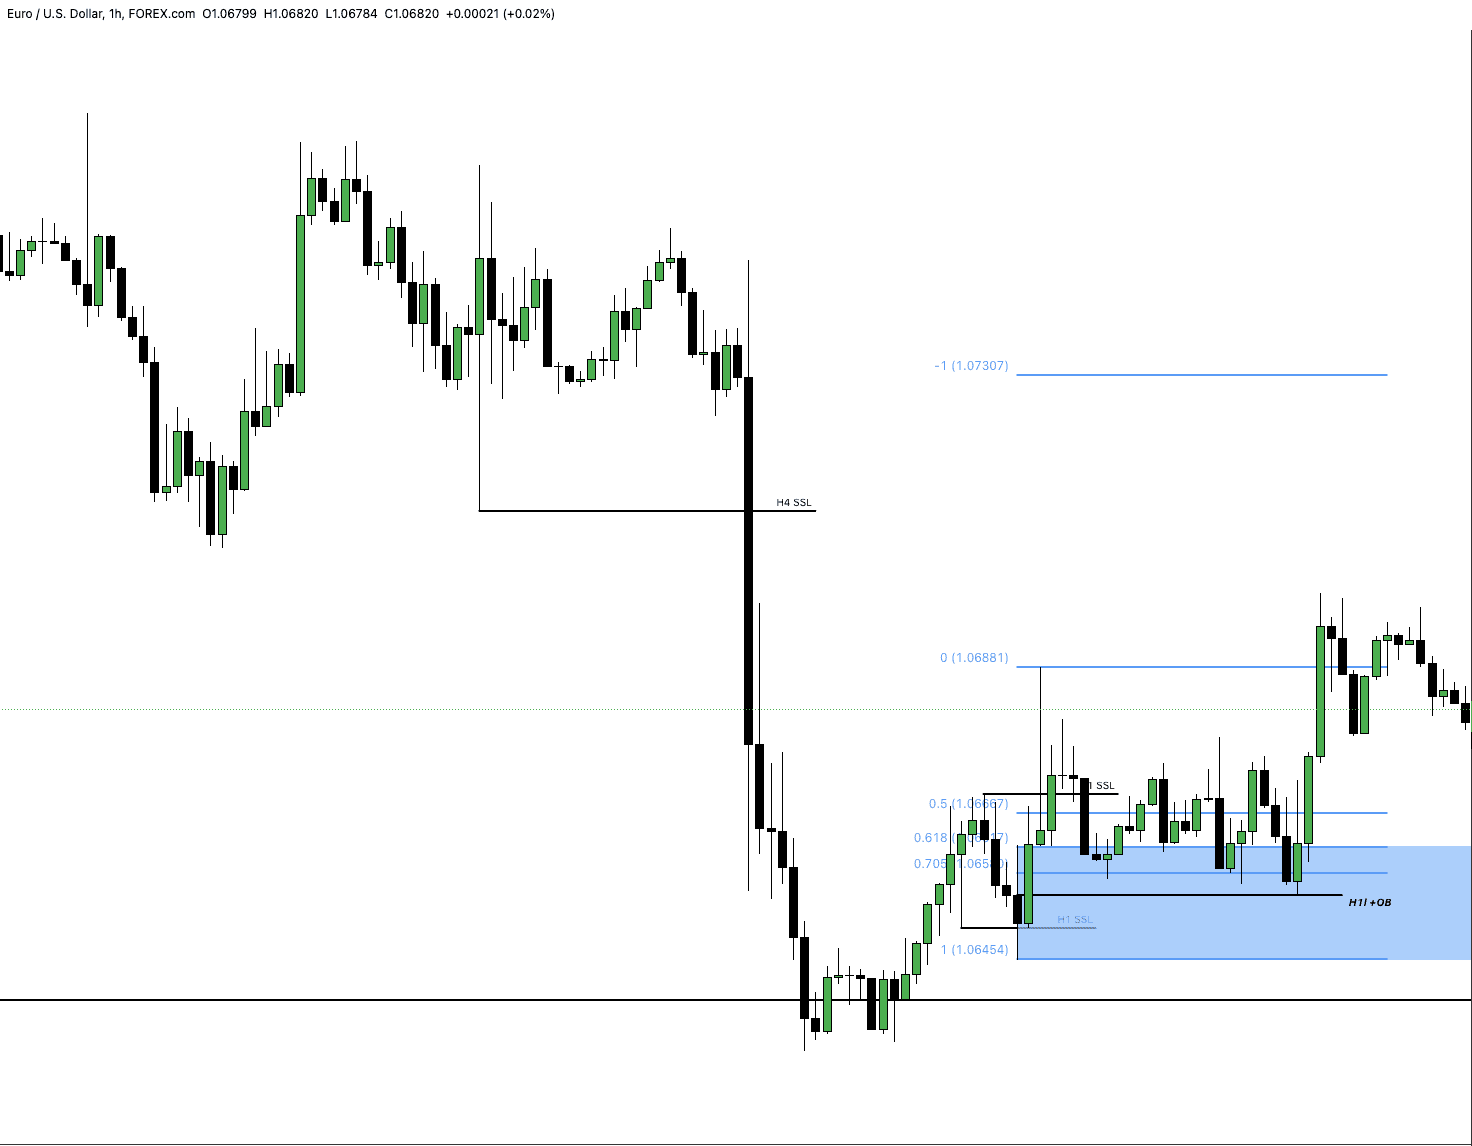
Ignore the fact that the image shows price action up to Tuesday. My thoughts when looking at this pre-market were. If I am to see a price increase in EURO, I need to have some confirmation here. I've marked out the H1 dealing range and it's showing me it is bullish. The H1 order block is marked out too using the body of the candle. I'll wait for price to reach this and its in a killzone then I'm looking to take an entry long provided it meets my entry criteria.